Normal probability distribution in Octave
This Octave program creates a plot of the normal probability distribution.
x=[-4:0.1:4];
plot (x,normpdf(x,0,1));
print -dpng "-S400,400" normal.png
The output looks like this:
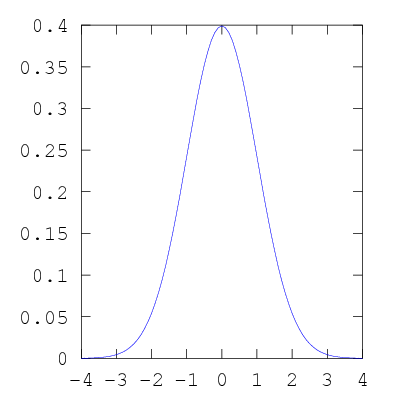
The 0 is the mean and the 1 is the variance of the normal probability distribution.
Copyright © Ben Bullock 2009-2026. All
rights reserved.
For comments, questions, and corrections, please email
Ben Bullock
(benkasminbullock@gmail.com).
/
Privacy /
Disclaimer