Demonstrating the log inequalities with Octave
This Octave program demonstrates the log inequalities $$\ln a \leq a - 1$$ and $$\ln a \geq 1 - {1 \over a}$$ for $a > 0$.
x = [0.1:0.01:3];
y = x .- 1;
z = 1 .- 1 ./ x;
hold on
plot (x, y, "g")
plot (x, log (x), "r")
plot (x, z, "b")
print ("logineq.png", "-S600,400")
replot
The output image looks like this:
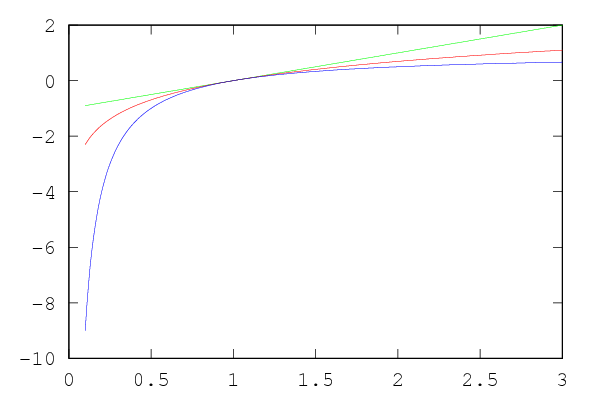
The green line is $a - 1$, the red line is $\ln a$, and the blue line is $1 - {1 \over a}$.
Copyright © Ben Bullock 2009-2026. All
rights reserved.
For comments, questions, and corrections, please email
Ben Bullock
(benkasminbullock@gmail.com).
/
Privacy /
Disclaimer